GRAN FONDO reader’s survey 2020 – The results
Who is the typical GRAN FONDO reader? Which bikes and brands are currently the most sought after and which ones will soon set new benchmarks? More than 8,000 readers from all over the world accepted our invitation to take part in our reader survey and gave us an insight into the newest developments and changes in the world of drop bar bikes.
First of all, we want to thank you! Without your engagement we wouldn’t be able to put together this article, nor would we have anybody to write our articles for. In short: without you, there’s no us! That’s exactly why this reader survey is such an important building block of our magazine. It helps us to get to know you better, to understand what makes you tick and what’s important to you. Ultimately, everything we do revolves around you – we want to deliver the content and bikes that you are interested in and excited by.
Between April and July 2020, more than 8,000 participants took up the invitation to take part in our reader survey, more than ever before! Counting together the time spent by all participants, you’ve accumulated more than 100 days answering our questions. That’s a huge achievement and deserves our greatest respect. Thanks again to all of you! You are part of one of the biggest and most representative surveys in the drop bar world! In addition, your participation doesn’t just shape our work and the editorial direction of GRAN FONDO but also influences the development of the entire sector. That’s because many well-known brands use the results of our survey (anonymised, of course) and let them feed into the development of their bikes.
Who are you?
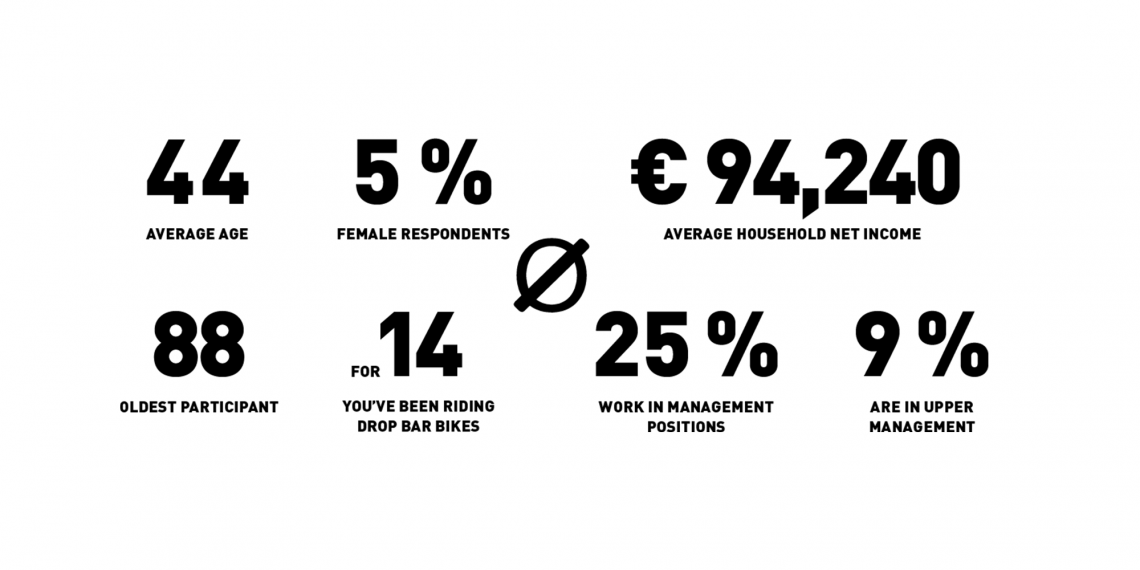
Over to you. What do typical GRAN FONDO readers look like? This year, the average age is 44, though respondents range in age from 16- all the way up to 88-years-old! The most common names this year are again headed up by Thomas, closely followed by Michael and Stefan. Amongst the women, An(n)a is the most common name, followed by Claudia and Laura. Incidentally, the proportion of female respondents this year grew by two points to 5%. Of course, there’s still some room for improvement but at least the numbers are going in the right direction. There have clearly been some positive developments with your household income too. On average, it rose by more than € 4,600 to € 94,000. Things are going well then! That’s not a huge surprise, given that 25% of you work in managerial roles. A further 9% of you even belong to the managing board of your company. Additionally, more than 81% of you have finished higher education, while almost 8% even have a doctorate. On average, you’ve been riding a road bike for 14 years. That said, just under 10% of you are newbies and have only been riding for less than a year. Welcome to the family! And to everyone else, nice to see you again!

Where do you come from?
Our readership comes from all over the world, hailing from 87 different countries. The largest proportion comes from German-speaking regions. Around 52% are from Germany, 6% from Switzerland and 5% from Austria. The USA and UK are also well-represented with 7% and 6% respectively. There are of course many participants from smaller countries too – a heartfelt greeting to our reader from the Pacific island of Kiribati. As soon as the situation allows, we’re looking forward to an invitation to visit 😉 A slim majority of GRAN FONDO readers live in towns or cities. Around 53% have said that they’re living in a place with a population greater than 100,000 inhabitants. Indeed, more than 20% live in cities with more than a million inhabitants. In contrast, 47% live in towns with a population of less than 100,000. 14% live in villages with less than 5,000 inhabitants. However, 36% of towns are located in metropolitan areas. Count them and almost 70% of our participants live in urban regions.

What do you do apart from biking?
You’re quite obviously well-acquainted with the good life. Alongside bikes, you enjoy spending your time travelling or indulging in quality coffee. Is it a coincidence that all three make for such a great combination? We don’t think so! It’s not particularly surprising then, that 52% of you have previously been on holiday with your bike – on average it was for 8 days last year during which you spent an average of € 189 per day. Camping and vanlife are also increasingly popular topics. In addition, a third of you are interested in electronics and photography. There’s also a lot of interest in E- and urban mobility. Want to find out more? Then we recommend visiting our sister magazine DOWNTOWN, where you’ll find everything you need to know about modern living and mobility in the city.
Into the garage! Which bikes do you ride?
We wanted to find out which kind of bikes you have in your garage, cellar, or wherever you keep them. The initially surprising winner: mountain bikes. Admittedly, mountain bikes have less competition because we didn’t differentiate between categories in our survey. However, if we just consider the drop bar models, then we have a new frontrunner this year: gravel bikes! 47% of you now own one, which is a growth of 8 points over last year. Race bikes have been pushed back to second place, losing 9 points to sit at 43% this year. Endurance bikes have also lost out but keep third place.
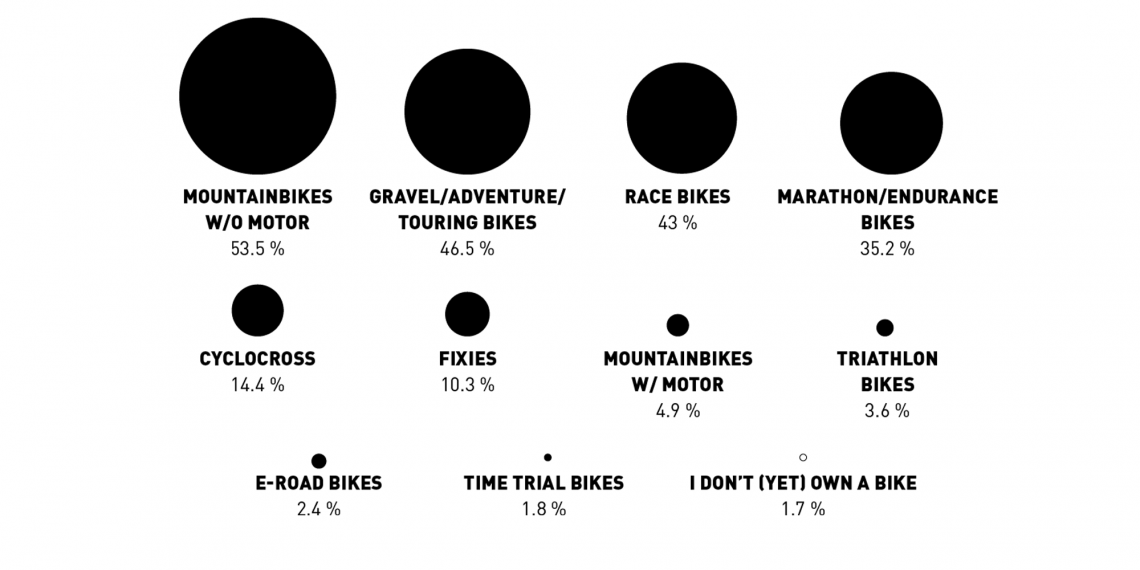
Note: as it was possible to choose more than one option, counted together, the answers sum to more than 100%.
What do you ride most often?
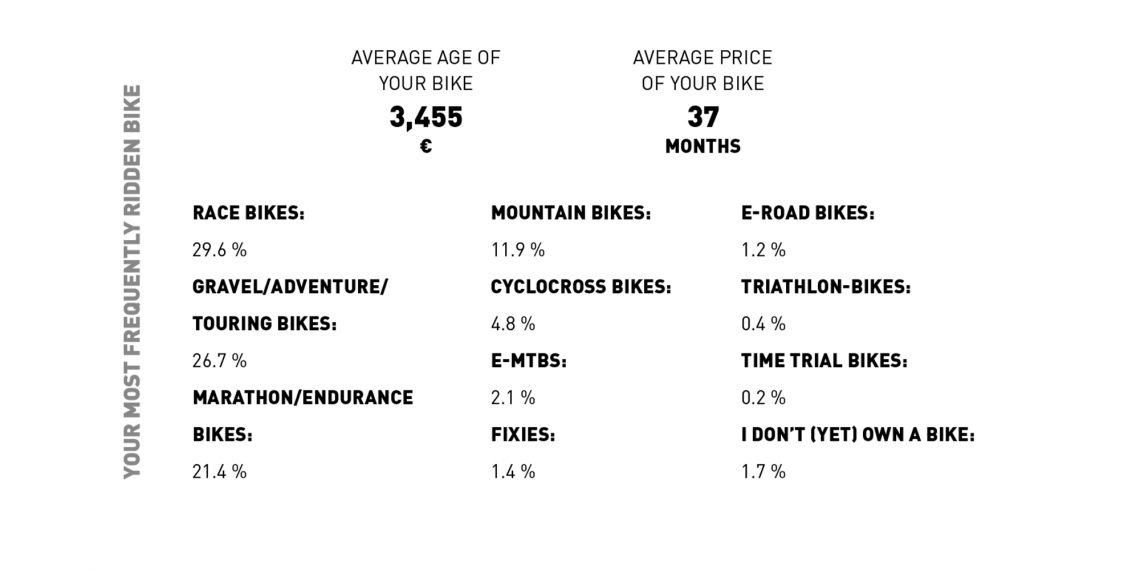
We didn’t just ask which bikes you own but also which bike you ride most often. It’s impossible to ignore the continuing triumph of gravel bikes. However, even with significant losses, race bikes have maintained pole position, with 30% of the vote, for now, but will that still be the case next year? After all, gravel bikes have gained 7 percentage points and, now at 27%, are in second place. They’ve pushed endurance bikes, at 21%, back to third place. Mountain bikes reach a 12% share and cyclocross bikes 5%. You’ve owned your most frequently used bike for 37 months, 4 months longer than last year. On average, you paid € 3,450 for your bike.
How do you use your bike? And have you all gotten lazy?
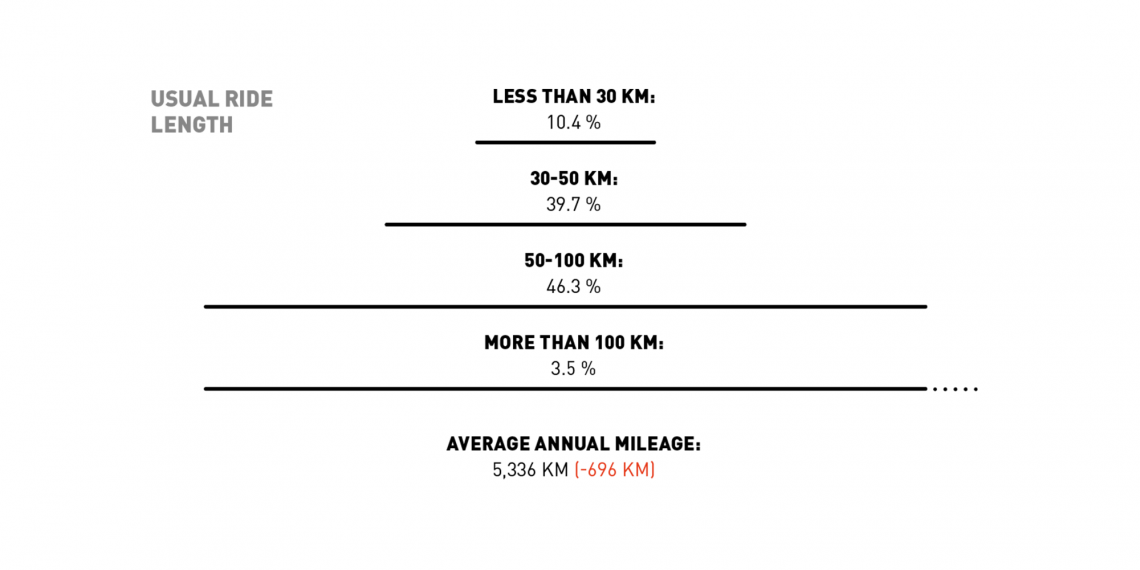
We asked you how you use your bikes. As it turned out, 46% of you usually head out for rides between 50 and 100 km long. That’s still the largest proportion but compared to last year is a reduction of almost 8 percentage points. Similarly, the proportion of those who mainly go out for rides longer than 100 km has almost halved to 3.5%. In turn, the proportion riding between 30 and 50 km has risen by 7 points to almost 40%. And the proportion riding routes of 30 km or less rose significantly by 4 percentage points to more than 10%. Sounds like a lot of microadventures and pleasant rides to us!
Correspondingly, the average distance ridden this year has fallen by more than 10% to 5,336 km. What are our conclusions here? Have you all got lazy? No, we don’t think that’s the case! Instead, we think there’s a connection with the gravel trend, because if you’re spending more time off-road, then in general, you’ll be riding shorter loops with the same effort you’d expend on a more traditional road bike. Of course, travel restriction could also have played a role this year, because those who would otherwise go to Mallorca for a week-long training camp would easily have ridden several hundred if not thousand kilometres while there. All we can say is, don’t put yourself under any pressure and just enjoy the ride.
Which surfaces do you ride on?
Regarding the question on which type of surface you usually ride, the gravel trend is again unmistakable. Roads in good condition maintain first place and are ridden regularly by 79% of you. However, that’s 3 percentage points less than last year. Roads in poor condition have lost 8 percentage points and now sit at 58%. The predictable winners in this category are gravel and forest tracks, which have gained by 6 points over last year and now sit at 54%. Off-road and trails are getting more popular too at 21%. In contrast, cobblestones have had to take a hit and are only ridden regularly by 16% of you.
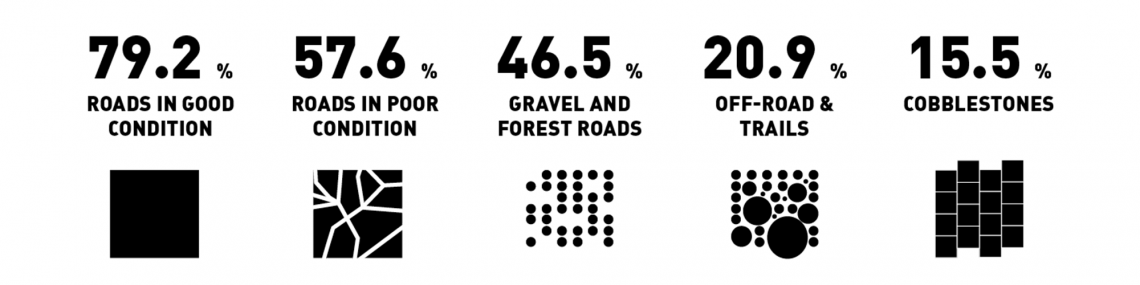
Note: as it was possible to choose more than one option, counted together, the answers sum to more than 100%.
Do you record your rides?
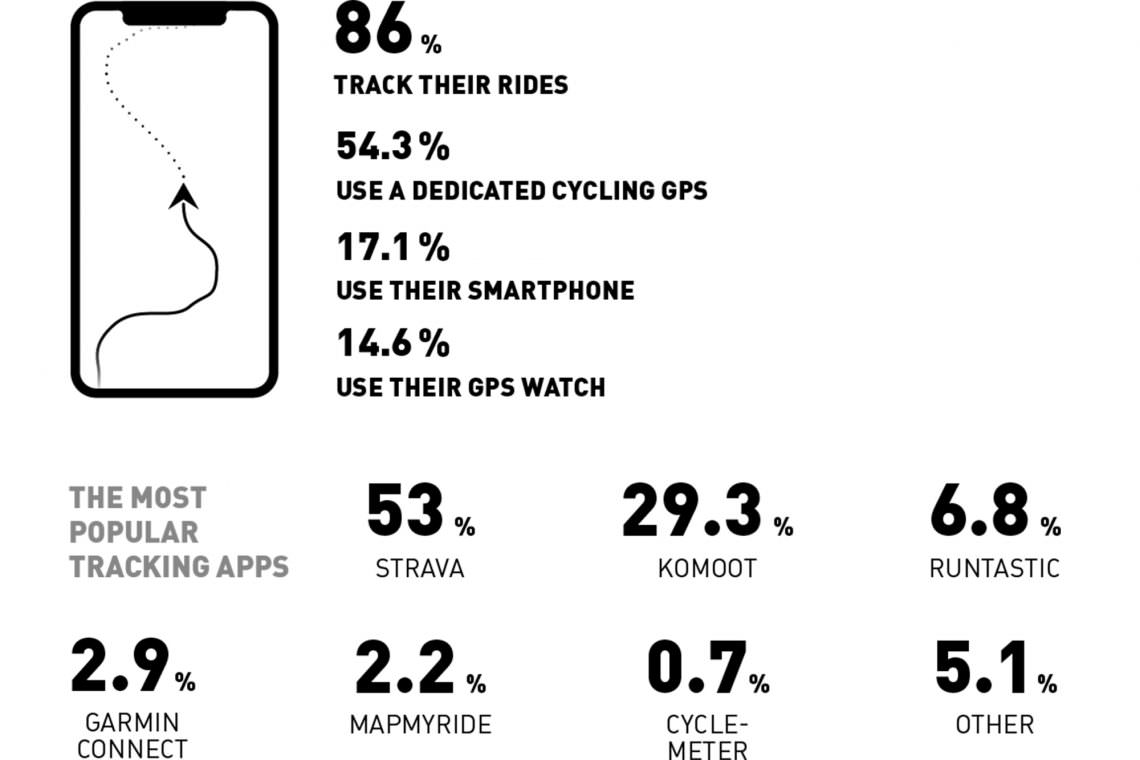
In the drop bar world, recording rides and being able to show off digitally to track performance is part and parcel, as the results of our survey verified. 86% of you track your rides. The majority, more than 54%, use a dedicated GPS device. 17% use their smartphone and a further 15% use a GPS watch. The most popular smartphone tracking apps are Strava (53%) and Komoot (29%). Just 14% of you don’t track your rides. Tracking rides might be widespread but it’s most frequent amongst the most dedicated riders who tend to go out for long rides and do a lot of yearly mileage. If you’re training and pushing your limits, you want verification of what you’ve achieved and want to keep an eye on your training load and how your fitness is progressing.
Which brands do you ride? The top 10 most frequently ridden drop bar bike brands
Of particular interest each year is the question of which brands you’re riding. There have been some significant changes in the top 10 this year. The top three spots might have remained the same but it’s a much tighter race than it was last year. Correspondingly, Canyon maintain first place with 12.4% but have lost 1.8 points. Specialized continue to claim second place. The US brand has increased its vote by 0.4 percentage points to 9.0%. Third place goes to Cannondale, who have increased their vote by 1.5%, reaching 8.8% and sitting just behind Specialized. ROSE are also included amongst the winners, having gained 1.1 percentage points to sit in fifth place with 5.4%, gaining two places over last year.
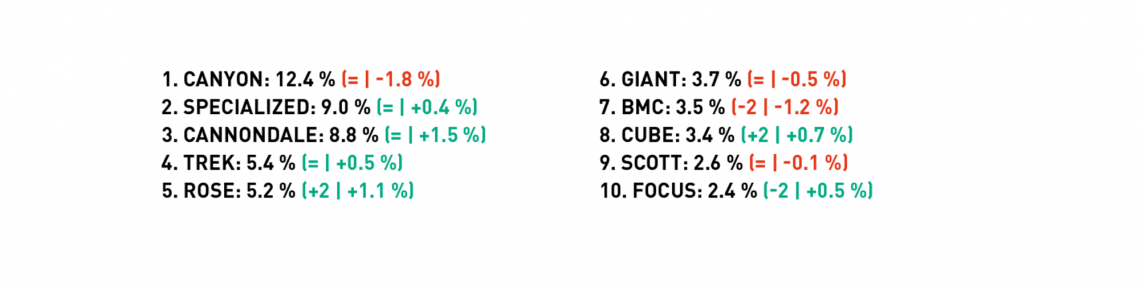
Guide: brand and market share (position change compared to last year | change in market share in percentage points)
How happy are you with your bike?
Next, you were asked to rate your most frequently ridden bike on a scale from 0 (completely dissatisfied) to 5 (completely satisfied). The average dropped by 0.05 points to 4.13 this year. However, with so little change, we don’t want to read too much into it. However, as it’s the first time that the upward trend has been interrupted, we do want to take a look at some possible explanations. One option could be the high demand for bikes in the last few months. On the one hand, service quality has suffered from unusually high demand and on the other, there are lots more beginners, who will likely have comparatively more problems than more experienced riders. A further reason could be the higher average age of the bikes compared to last year, as an older bike tends to exhibit more problems. Fundamentally, we have to remember that we are already at a very high level of satisfaction that offers relatively little room for improvement.
Take a closer look at which brands have the most satisfied customers and OPEN sit in pole position, significantly ahead of the rest of the field with an average rating of 4.69. In positions 2 and 3, Pinarello and SIMPLON have scores of 4.48 and 4.41.

Guide: brand and average satisfaction on a scale from 0 (completely unsatisfied) to 5 (completely satisfied)
What do you want to buy next?
We don’t just want our survey to help us understand the status quo but want it to let us take a look into the future as well. It’s especially important for planning our group tests to know which bikes and brands you want to buy in the future. In total, 31% of you are planning to buy a new drop bar bike in the next 12 months. Furthermore, 6% want to buy a different kind of bike, like an (E-)mountain bike or urban bike. A further 28% aren’t yet sure where they will buy a new bike. The average budget for the next bike is € 4,160. That’s a little less than last year, but after all, there are more than enough reasons given the current situation.
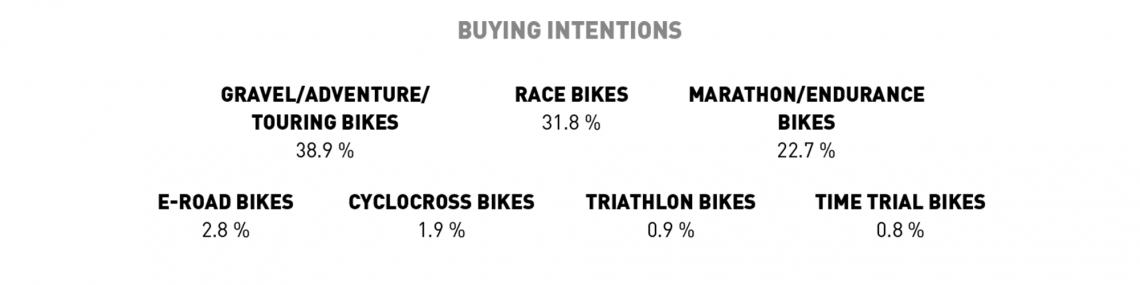
The gravel trend is also reflected in the buying intentions, as this year, gravel takes the win. At 39%, gravel bikes are significantly ahead of race bikes that only take 32% of the vote. Endurance bikes have remained roughly the same at 23%.
Which brands do you want to buy? The top 10
Looking at the top 10 brands that you plan to buy, a lot has changed compared to last year. However, the two leaders have remained the same. The win goes to Canyon again with a 17% vote share although that’s a loss of 2 percentage points. Specialized are in second place. The US brand has lost around half a point and now takes 10% of the vote. Those two aside, there have been changes in almost every position on the leaderboard. Cannondale are new in third place, having gained a place with an increase of 1.4 points to 8.6% They are followed by another big winner: ROSE. The direct to consumer brand has climbed from fifth to fourth place and has gained an impressive 3 percentage points. ROSE now make up 8.6% of planned purchases. No wonder, since they received two Best Buys from us in our group tests this year!

Guide: brand and vote share for next purchase (position change compared to last year | change in vote share in percentage points)
Is carbon the only option?
Carbon is the measure of all things: light, stiff, but also compliant when you need it to be. Carbon makes it possible to reconcile the irreconcilable. The lineups in our group tests only prove that fact. That said, there are also good reasons to use other materials like steel, titanium and of course aluminium, as our group tests have also shown! But how does it look in the real-world? Which material are you riding and what do you want to ride in the future? Currently, around 60% of you rely on a carbon frame, 2 percentage points less than last year. The deciding factor could once again be the growing proportion of gravel bikes, amongst which you’ll find a comparatively larger proportion of aluminium or steel frames. Overall, aluminium sits at 30% while steel bikes reach almost 8%. Titanium has a share of a little more than 2%. Fundamentally, the demand for carbon hasn’t abated even if it has stagnated slightly this year. As before, 70% want their next bike to have a carbon frame. 19% want aluminium, 7% want steel and 4% titanium.

Which size tire do you ride?
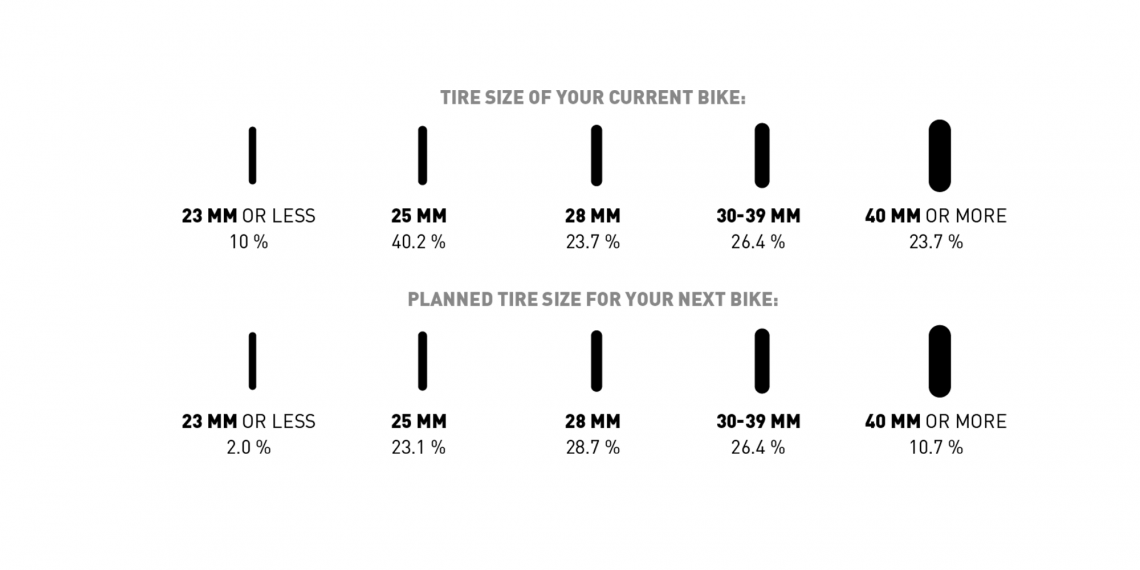
If you’ve read diligently up to this point, or read our articles in the last few years, then you won’t be particularly surprised by our next finding. You’re getting fatter! And we’re diggin’ it! 😉 7% of you ride 23 mm or narrower tires, a further 2 points down on last year. Will the 23 mm tire soon completely disappear as a tire size? The largest proportion of you ride a 25 mm tire and despite losing 8 points, it still garners 40% of the vote. As a result, for the first time ever, the majority of our readers are riding 28 mm or wider tires. Almost 29% of you ride 28 mm tires. 26% ride tires between 30 and 39 mm and the remaining 11% ride tires that are 40 mm or more. Your purchasing intentions reflect these developments, as a majority of 55% want a tire size between 28 and 39 mm for their next bike.
Disc brakes – Hot or not?
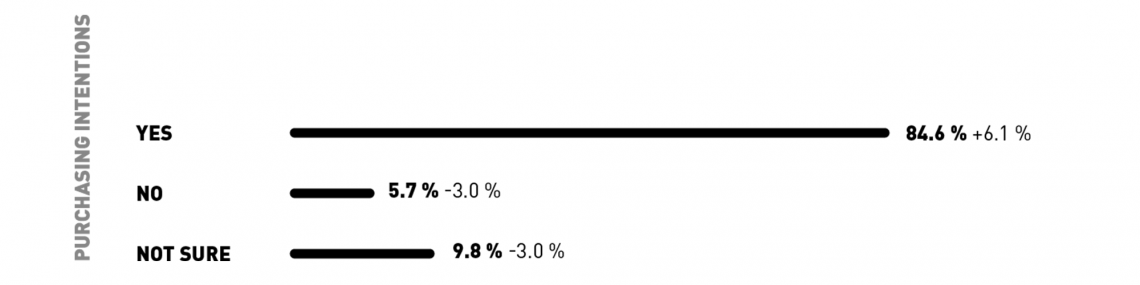
One of the hottest and simultaneously most sensible trends of the last few years: disc brakes! This year, an additional 11 percentage points’ worth of you are riding around with disc brakes, making it almost 57%. That doesn’t surprise us because disc brakes shine in all weather conditions with easy to modulate power – a big win for safety. Look at purchasing intentions and the trend becomes even clearer. Almost 85% of you want disc brakes on your next bike. Less than 6% don’t want disc brakes while the rest are undecided. The most opposition to disc brakes comes from longtime road riders and more traditional cycling nations like France, Italy and Spain, that still display a high level of affinity for rim brakes. But even there, the trend is going in the same direction, even if it is delayed a bit.
Which groupset is your favourite?
Shimano continue to dominate the field when it comes to groupsets, even making small gains, meaning that Shimano drivetrains are found on almost three-quarters of your bikes. Electronic Di2 shifting makes up more than a fifth of those. Around 20% of the bikes have a SRAM drivetrain, with electronic eTap making up more than a third. 6% of bikes have Campagnolo, though here only around one in ten are electronic Campagnolo EPS drivetrains.
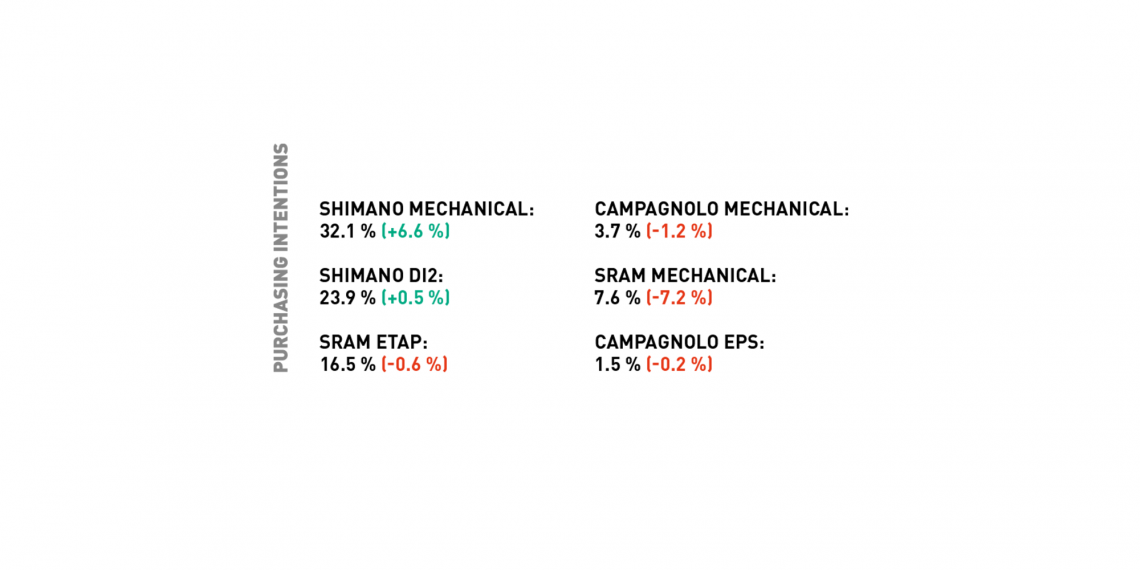
For your next bike, Shimano also hold the majority but, with 56% of the vote, don’t dominate quite so decisively as they do with your current bikes. SRAM get 24% and Campagnolo 5%. Regardless of manufacturer, it’s noticeable that there’s a significant amount of interest in electronic shifting, as more than 40% want it for your next bike.
All about gravel? Gravel in focus
Without a doubt, the big winner in this reader survey is gravel. That’s why we want to take a moment to better understand your interest, look at the numbers and even tell you about a few more. Let’s start by looking at the lay of the land and consider which first-time wins gravel has managed to secure this year. For the first time, gravel bikes are the most commonly owned bike. In this category, they sit at 47% with an increase of 8 percentage points over last year. Interestingly, they’re not yet leading the most frequently ridden bikes, even if they are just 3 percentage points behind race bikes at 27%. As a result, it’s possible to conclude that for many people, gravel bikes ‘only’ complement their other bikes. Gravel bikes also secure a win in purchasing intentions, where they formed the largest proportion at 39%.
The trend is also clear to see in how and where people use their bikes, with gravel and forest tracks gaining 6 percentage points to reach 54%. The gravel trend is also bringing increasing numbers of new people to cycling. As a result, the proportion of newbies who started riding in the last year is particularly high at 15% amongst gravellers.
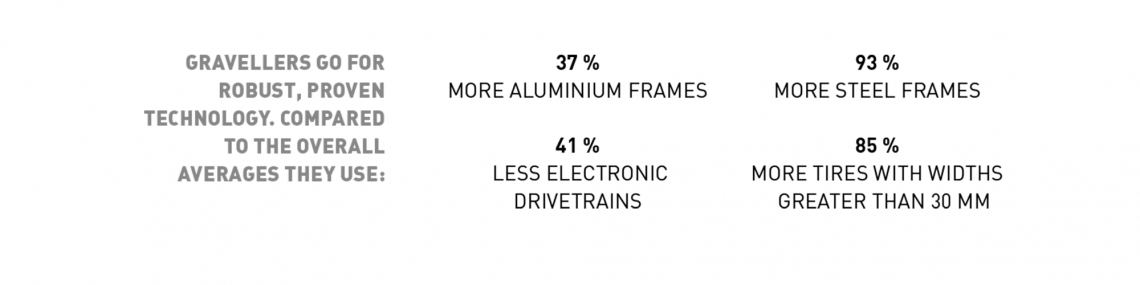
In terms of the bikes themselves, it’s clear that gravel riders are relying on proven and robust technologies. Correspondingly, at 41%, aluminium frames are much more widespread than the 30% overall average. In particular steel, at more than 13%, is more than double as common as the average. At 86%, mechanical drivetrains are a good 10 percentage points more common than their electronic counterparts. 46% of your votes deemed tires between 30 and 39 mm a favoured choice for gravel. 23% ride tires more than 40 mm wide.
Do you use an indoor trainer?
The drop bar world can hardly be imagined without indoor trainers anymore and they’re an important tool for many to be able to train not just independently of weather and time of day, but with targeted training goals. The topic is gaining increasing focus for us as well, which is why we asked you about it for the first time this year. The result: almost 47% of you own an indoor trainer, of which 60% are smart trainers and the remaining 40% classic trainers without any special features. A further 10% of you don’t yet have a trainer but plan to buy one soon. Around 43% of you don’t own a trainer. The most important reason for having one is to be able to ride independent of the weather. But flexibility in terms of when you do your workouts and training in a targeted and time-efficient way also play a significant role. We were interested to find out about the distribution of indoor and outdoor rides, so you were able to respond on a scale from 0 (only outdoors) to 5 (only indoors). The average value of 1.6 shows that, as is to be expected, indoor training simply complements outdoor training.
The USA stands out particularly here. 64% of respondents there own an indoor trainer. A plausible explanation could be worse cycling infrastructure in many places as well as the significant traffic making riding on the roads less safe and less appealing. We were also interested in your opinion on E-racing, for example on Zwift. Around 80% of you believe that E-racing will become a permanent fixture, not as a main event but primarily as a winter and bad-weather phenomenon. Around 15% believe E-racing will become a permanent fixture, on an equal footing to traditional racing. In contrast, 5% don’t believe that E-racing has a serious future.
What’s your attitude towards E-road bikes?
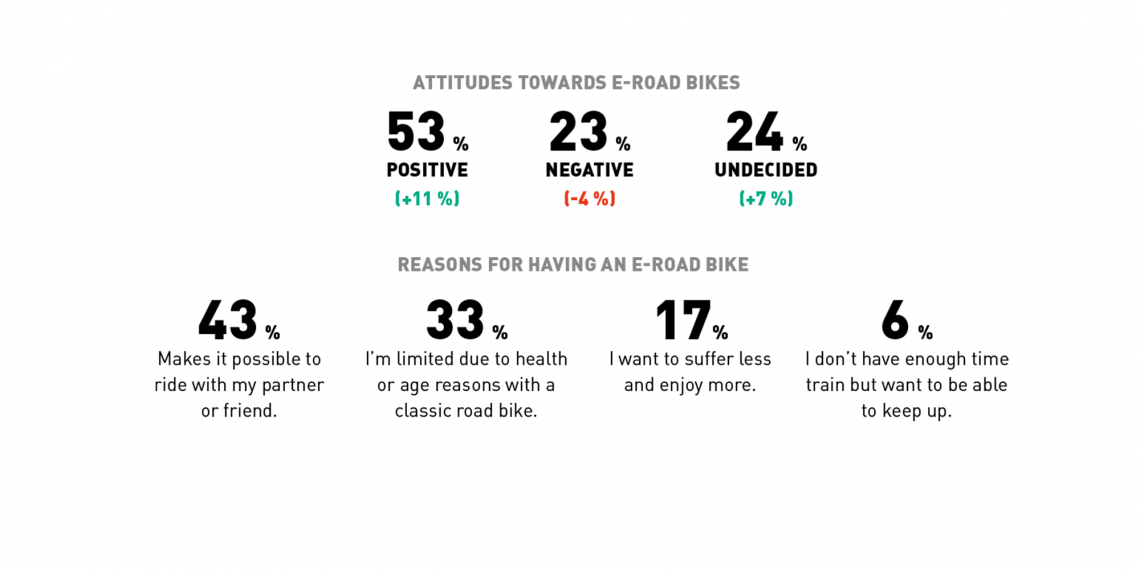
One of the most exciting and simultaneously polarising trends in recent years is the E-road bike. Where one person sees big opportunities, another feels personally aggrieved if they catch even a whiff of a new E-road bike being released. That’s the same experience that the E-mountain bike market went through in its nascent stages. But a similar acceptance is growing in the E-road bike segment and for the first time, the proponents are in the majority. 53% see their development as positive. That’s a generous 11 percentage points more than last year. At the same time, those against the trend have shrunk by 4 points to 23%. For you, the most important reason for buying an E-road is to equalise differences in fitness levels. Correspondingly, 43% don’t buy an E-road bike for themselves but for a partner, family or friends to make riding together possible. For 33% the reason is due to health problems that limit your fitness. An E-road bike lets you continue your hobby regardless. Around 6% don’t have enough time to train but still want to be able to ride with riders of different fitness levels. A further 17% just want to suffer less and enjoy their rides more, in particular on the climbs.
The number of E-road bikes is increasing visibly. This year, the proportion of people who own an E-road bike is 2.4% – that’s twice as much as last year! The proportion of those who primarily ride their E-road bike has tripled and is now at 1.2% Furthermore, 2.8% of planned purchases are E-road bikes. The numbers will likely continue to climb in the future. The most important criterion in the purchase of an E-road bike is how it rides above the 25 km/h assistance limit. As most riders spend a lot of time above this limit, the motor can’t exhibit any resistance. Second, comes the range of the battery. Further important criteria include natural handling, good comfort and weight. You can find an overview of the best E-road bikes in our big group test.
Do you want to customise your bike?
When it comes to whether you want to customise your bike, the answers this year are similar to those from last. Around 31% want to customise the components fitted to their bike but are happy with an off-the-peg frameset. 8% don’t just want to customise components but also want a custom-built frame. The stagnation of the trend towards individualising bikes could have to do with the increasing quality and versatility of production bikes leaving fewer and fewer desires unfulfilled. On the other hand, exactly that reason may be why people want personalised bikes to be able to stand out from the crowds. But the increase in online trade could also play a role, as you’ll usually have fewer individualisation options available to you.
Key Facts: 31% want to customise the components on their bike. 8% want a custom frame.
Best brands 2020 – Which are your favourite brands from the world of drop bar bikes?
Once again, we asked you which brands you think make the best bikes, components and accessories. Of course, the individual responses are subjective – after all the fewest of our readers have the opportunity to test and compare numerous different products themselves. Nonetheless, summed together, your responses are a clear indicator of which brands did the best job last season and have won their customers’ favour. With more than 8,000 participants these results come from one of the largest and most representative surveys on the scene. The brands that came out ahead, can rest assured that their mix of brand image, products, marketing and product performance convinced our readers. Specialized dominate again this year and take 21% of the vote, though with a loss of two percentage points. Like last year, second place goes to Canyon. They’ve also lost some votes but still get 11% of the share. The big winners in the top 10 are Pinarello and Cannondale, who have both won a lot of votes and improved their position in the rankings.

Guide: brand and vote share (position change compared to last year | change in vote share in percentage points)
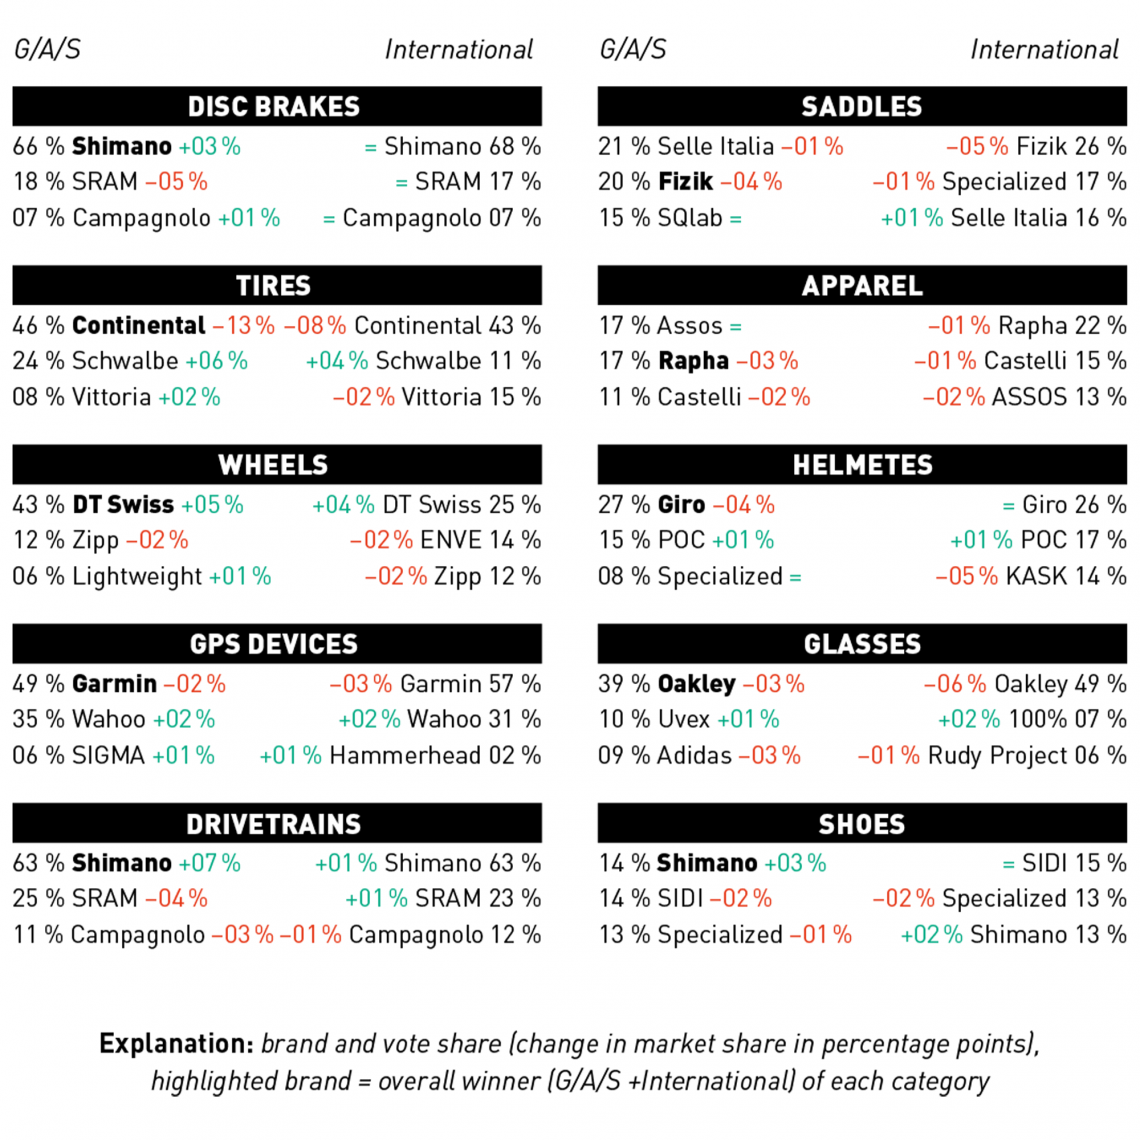
All the best brands in detail
Below you’ll find an overview of the top 3 in all the best brand categories such as components, clothing and accessories.
The lucky winners
We don’t just like our reader survey because we get to know you better, but because we have the chance to give two of you brand new bikes! Together with our partners Thömus and Cannondale, we raffled two bikes worth more than € 9,000 amongst our participants. The lucky winners are:
Did you enjoy this article? If so, we would be stoked if you decide to support us with a monthly contribution. By becoming a supporter of GRAN FONDO, you will help secure a sustainable future for high-quality cycling journalism. Click here to learn more.